How Do You Control Light?
The rules of fluorescence are simple. To see an element, you must send in at least 2 keV more of energy to see that element. This is why the voltage, or energy range, of your analysis is critical. If you select 15 keV, you will be optimized for elements lighter than iron, particularly elements like calcium, potassium, titanium, etc. If you select 40 keV, you will see all elements possible from barium and uranium down to aluminum. However, you won't be optimized for any of these elements - this is a jack of all trades, master of none approach. To get to optimal sensitivity for different materials, you must be able to control the five key parameters:
When in doubt, I recommend taking a spectra at 40 keV with no filter - this will provide you with a ‘jack of all trades, master of none’ spectrum. You will be able to see elements from Al to U with relative ease, but you won’t be optimized for any particular one.
The rules of fluorescence are simple. To see an element, you must send in at least 2 keV more of energy to see that element. This is why the voltage, or energy range, of your analysis is critical. If you select 15 keV, you will be optimized for elements lighter than iron, particularly elements like calcium, potassium, titanium, etc. If you select 40 keV, you will see all elements possible from barium and uranium down to aluminum. However, you won't be optimized for any of these elements - this is a jack of all trades, master of none approach. To get to optimal sensitivity for different materials, you must be able to control the five key parameters:
- Energy: Allows you to select which elements you see in your spectrum
- Current: Allows you to dim the light when measuring metals and turn it up when looking for ppm-level concentrations in oxides and organics
- Filter: Allows you to focus on key elemental ranges to identify elements at detection limits
- Time of Analysis: This must be controlled for always, particularly when you begin to pursue approaches such as Bayesian deconvolution
- Atmosphere: Dry air contains nitrogen, oxygen, and argon. This interferes with the measurement of light elements like magnesium and sodium. You can either introduce a vacuum or flow helium through the Tracer to see these light elements
When in doubt, I recommend taking a spectra at 40 keV with no filter - this will provide you with a ‘jack of all trades, master of none’ spectrum. You will be able to see elements from Al to U with relative ease, but you won’t be optimized for any particular one.
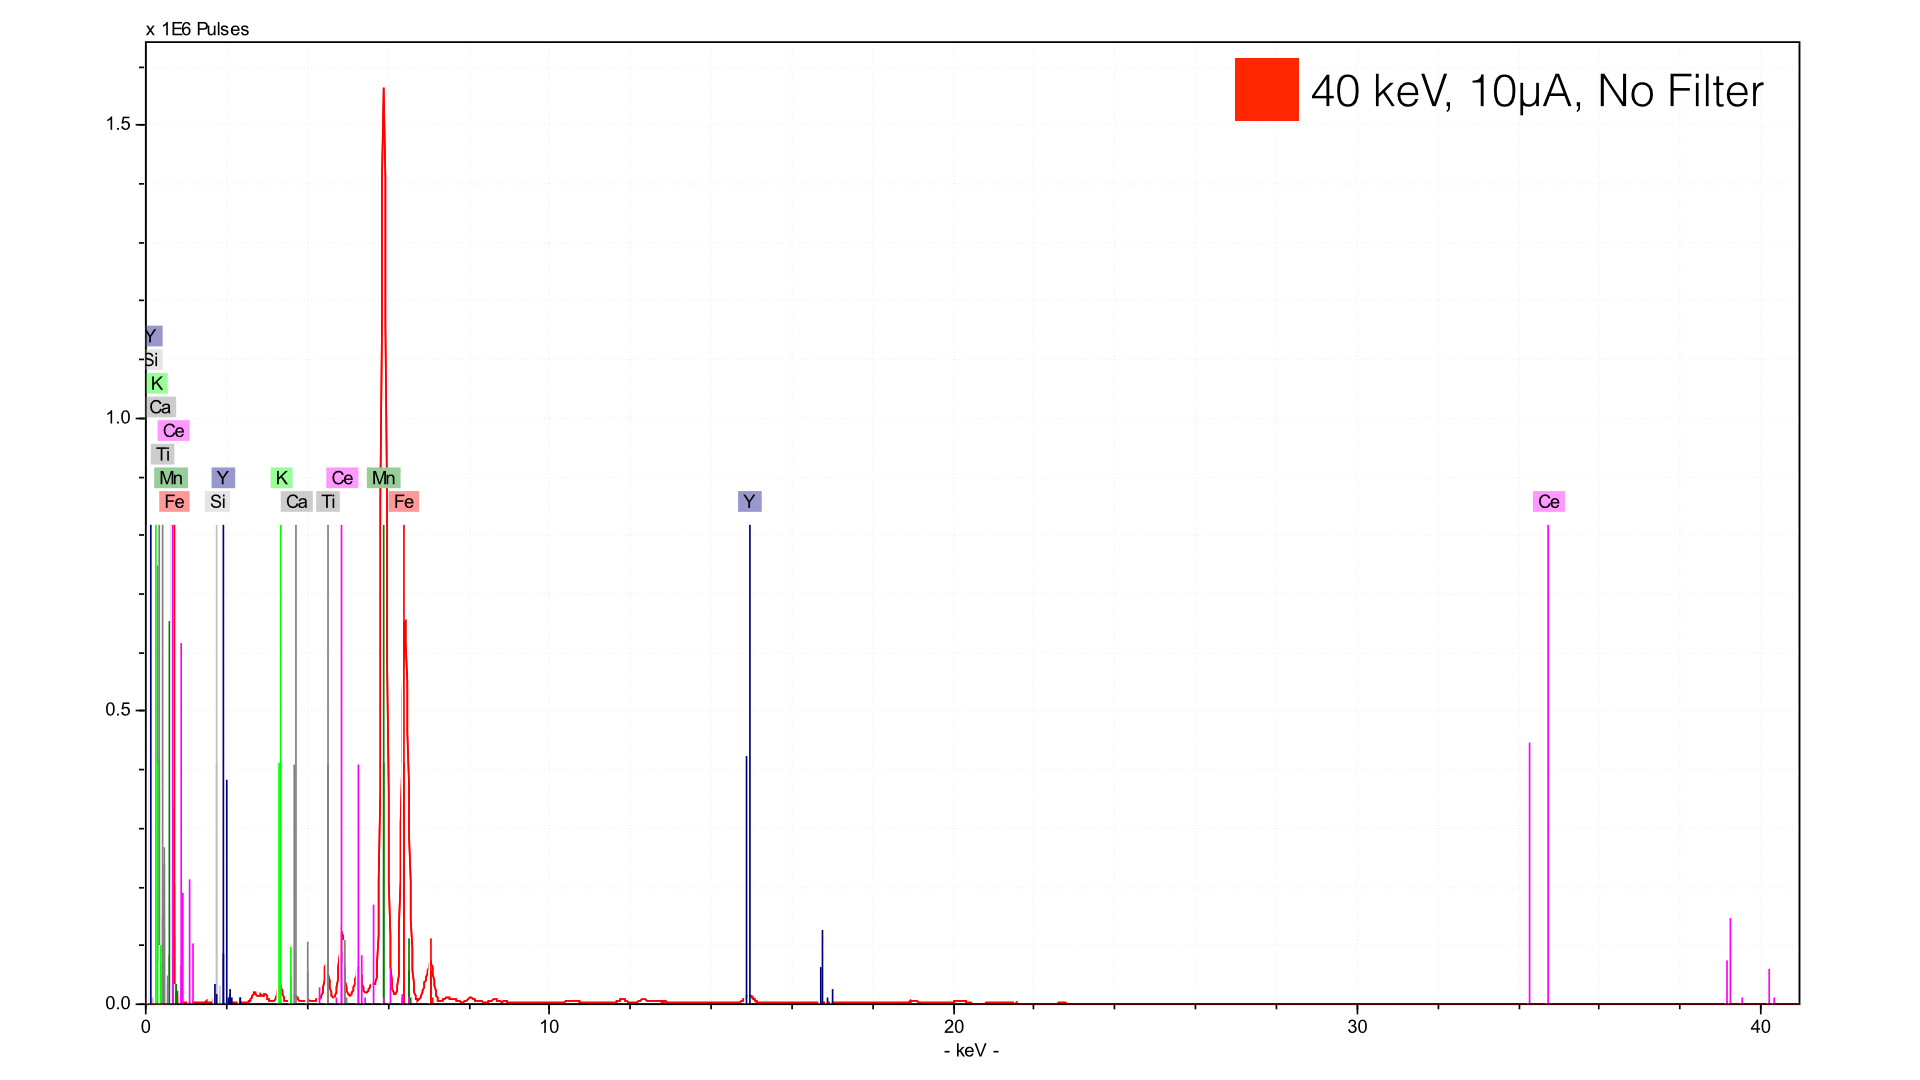
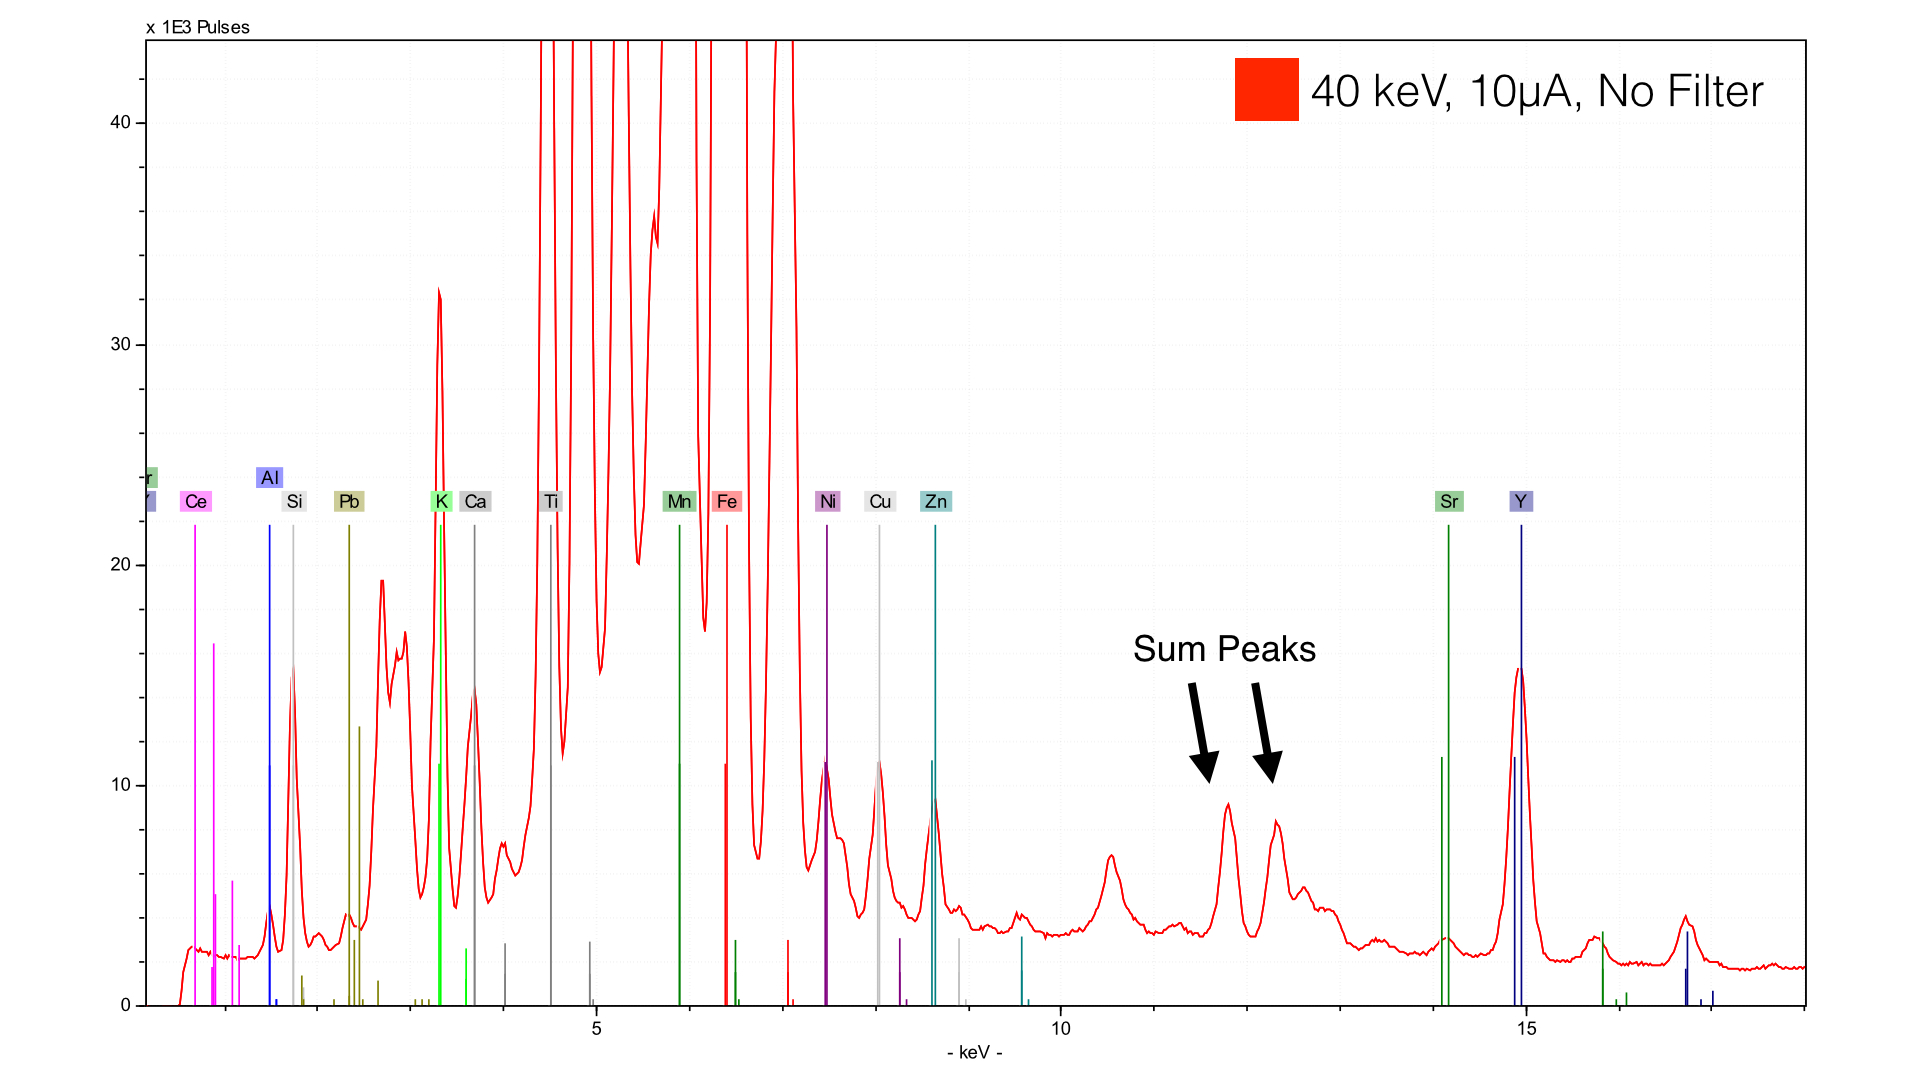
The benefit of this measurement is clear - you see just about every element that you can. The negatives are twofold. First, you will have a very high background scatter (brehmstalrung radiation). This will obscure peaks and make both qualitative and quantitative analysis difficult. Secondly, you will see a number of peaks that are generally not useful for interpretation. The XRF equipment you are using will show up. There will be increased occurrence of sum peaks and escape peaks. In some cases, I have even seen escape peaks of sum peaks. The best first step in getting rid of these interferences is to add a filter.
Filter Selection
Filter Selection
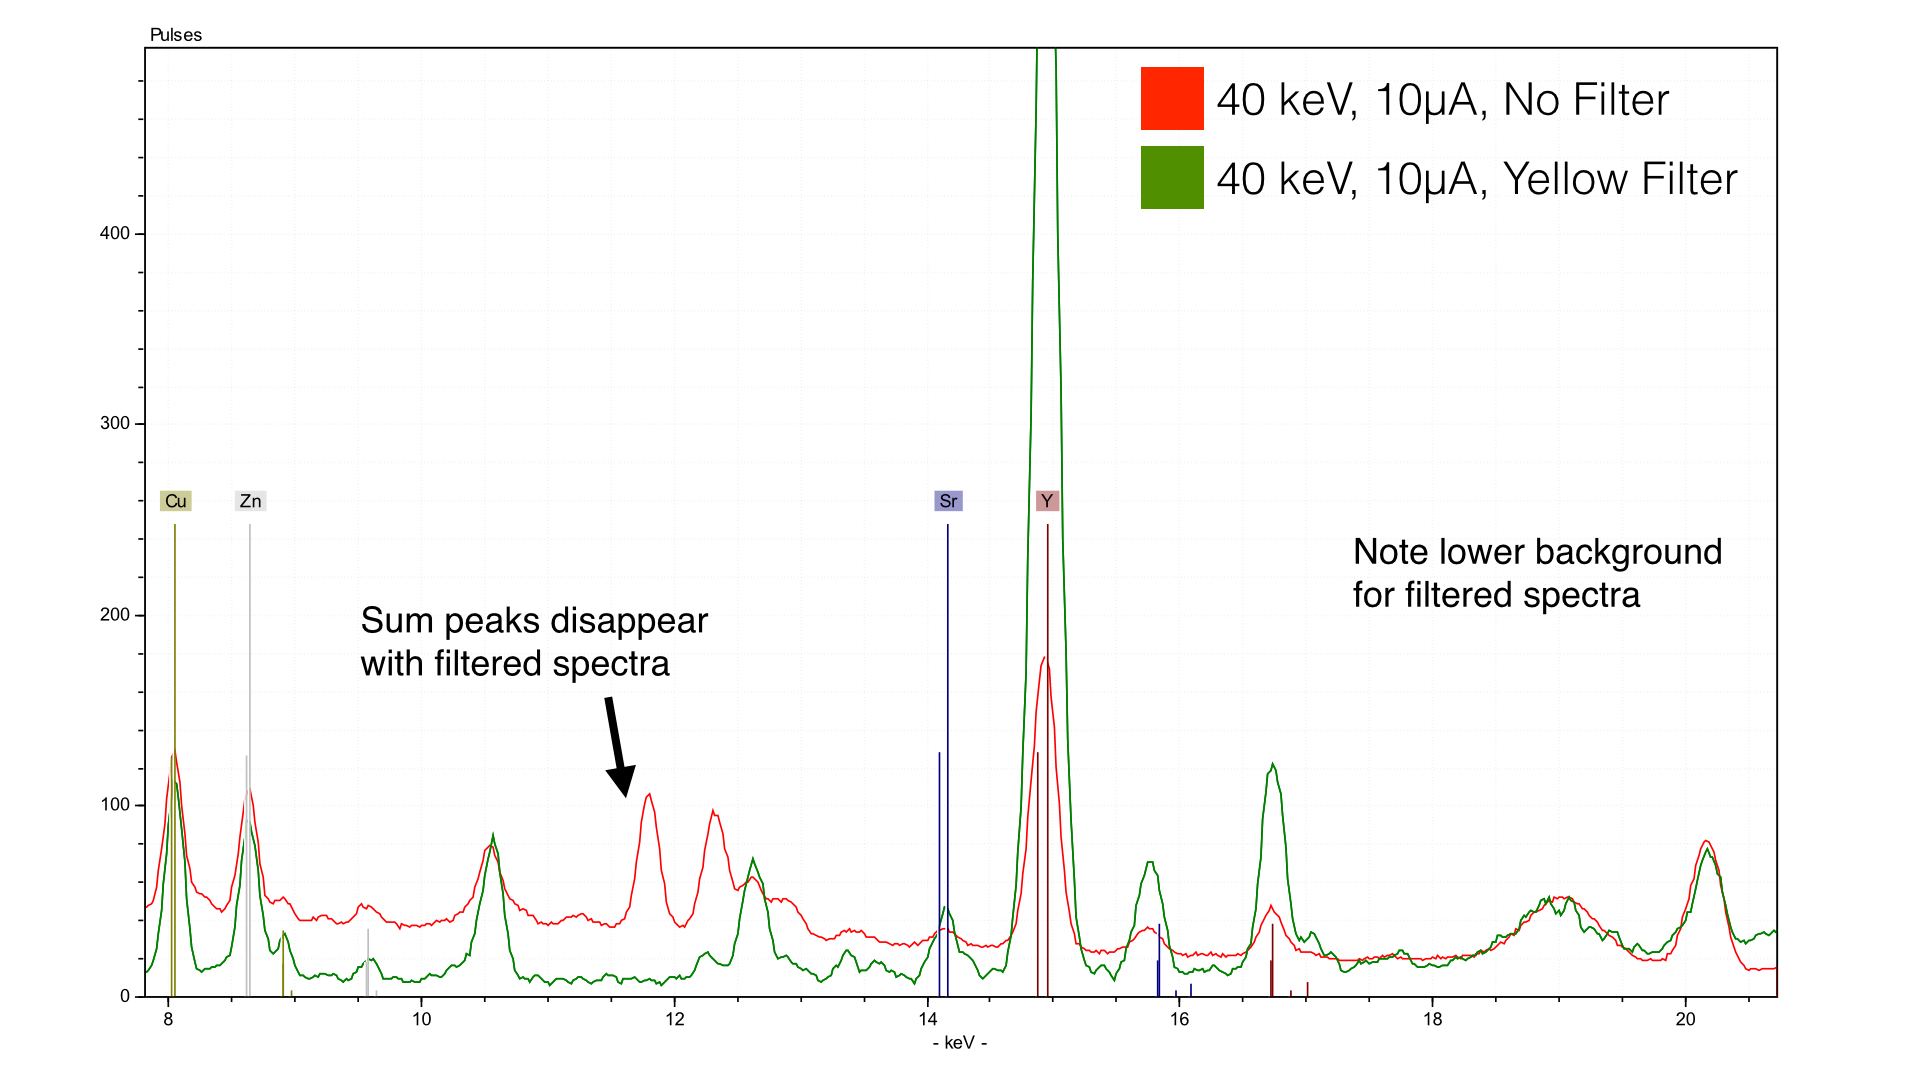
The use of a filter in this case has two primary functions: it decreases the background scatter and it lowers the count rates. Both factors result in a more easily interpretable spectra. Note the lowered baseline in the green spectra - it is much easier to interpret. The sum peaks are now gone as well - the primary reason for their existence in the first place were the high count rates.
But this leads to another question - how do you decide what filter you use? The answer to that question depends entirely on what elements you want to see:
But this leads to another question - how do you decide what filter you use? The answer to that question depends entirely on what elements you want to see:
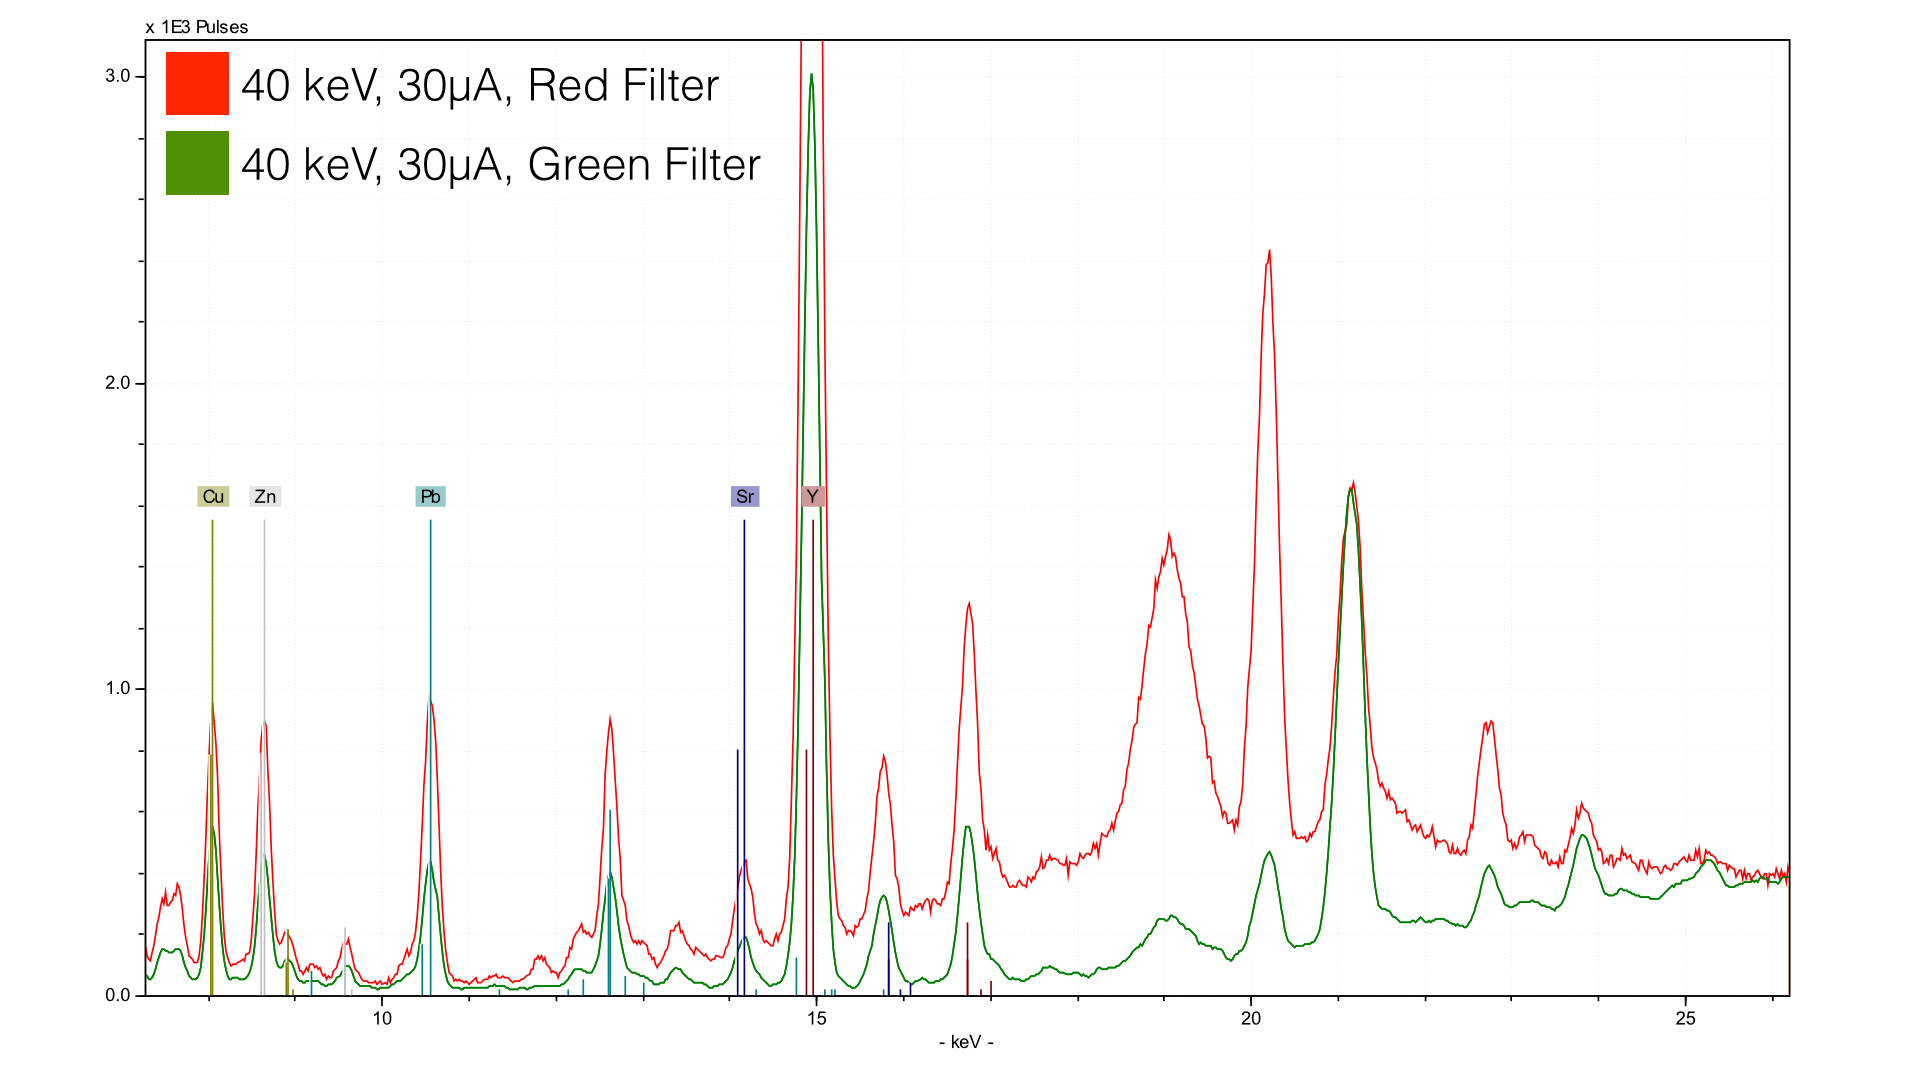
The green filter is composed of 150 μm Cu, 25 μm Ti, and 300 μm Al. The red filter, is identical save for the fact that it uses only 25 μm Cu. The result can be seen in the above graph - the background scatter of the red filter spectrum strikes its lowest point around 12 keV, while the green filter spectra does so at 17 keV. This creates different zones of optimization - with the red filter we end up with a zone of about 9 - 12 keV were there is an ideal signal to background ratio for elements (Pb, Hg As, Br, Au). The green filter sees the optimization in a higher energy range, from 13 - 17 keV (Th, Rb, U, Sr, Y, Zr, Nb, Mo).
The reason for this optimization has to do with the increased scatter to the right - that background scatter provides the photons which excite the elements downstream from it (e.g. at a lower energy). You can think of backscatter as a wave, and the element you want to see as a surfer. You will have the best conditions if you keep the wave cresting right in front (higher energy) of the surfer (element).
But that involves more than just using a filter - it also means selecting the right voltage (energy).
Energy
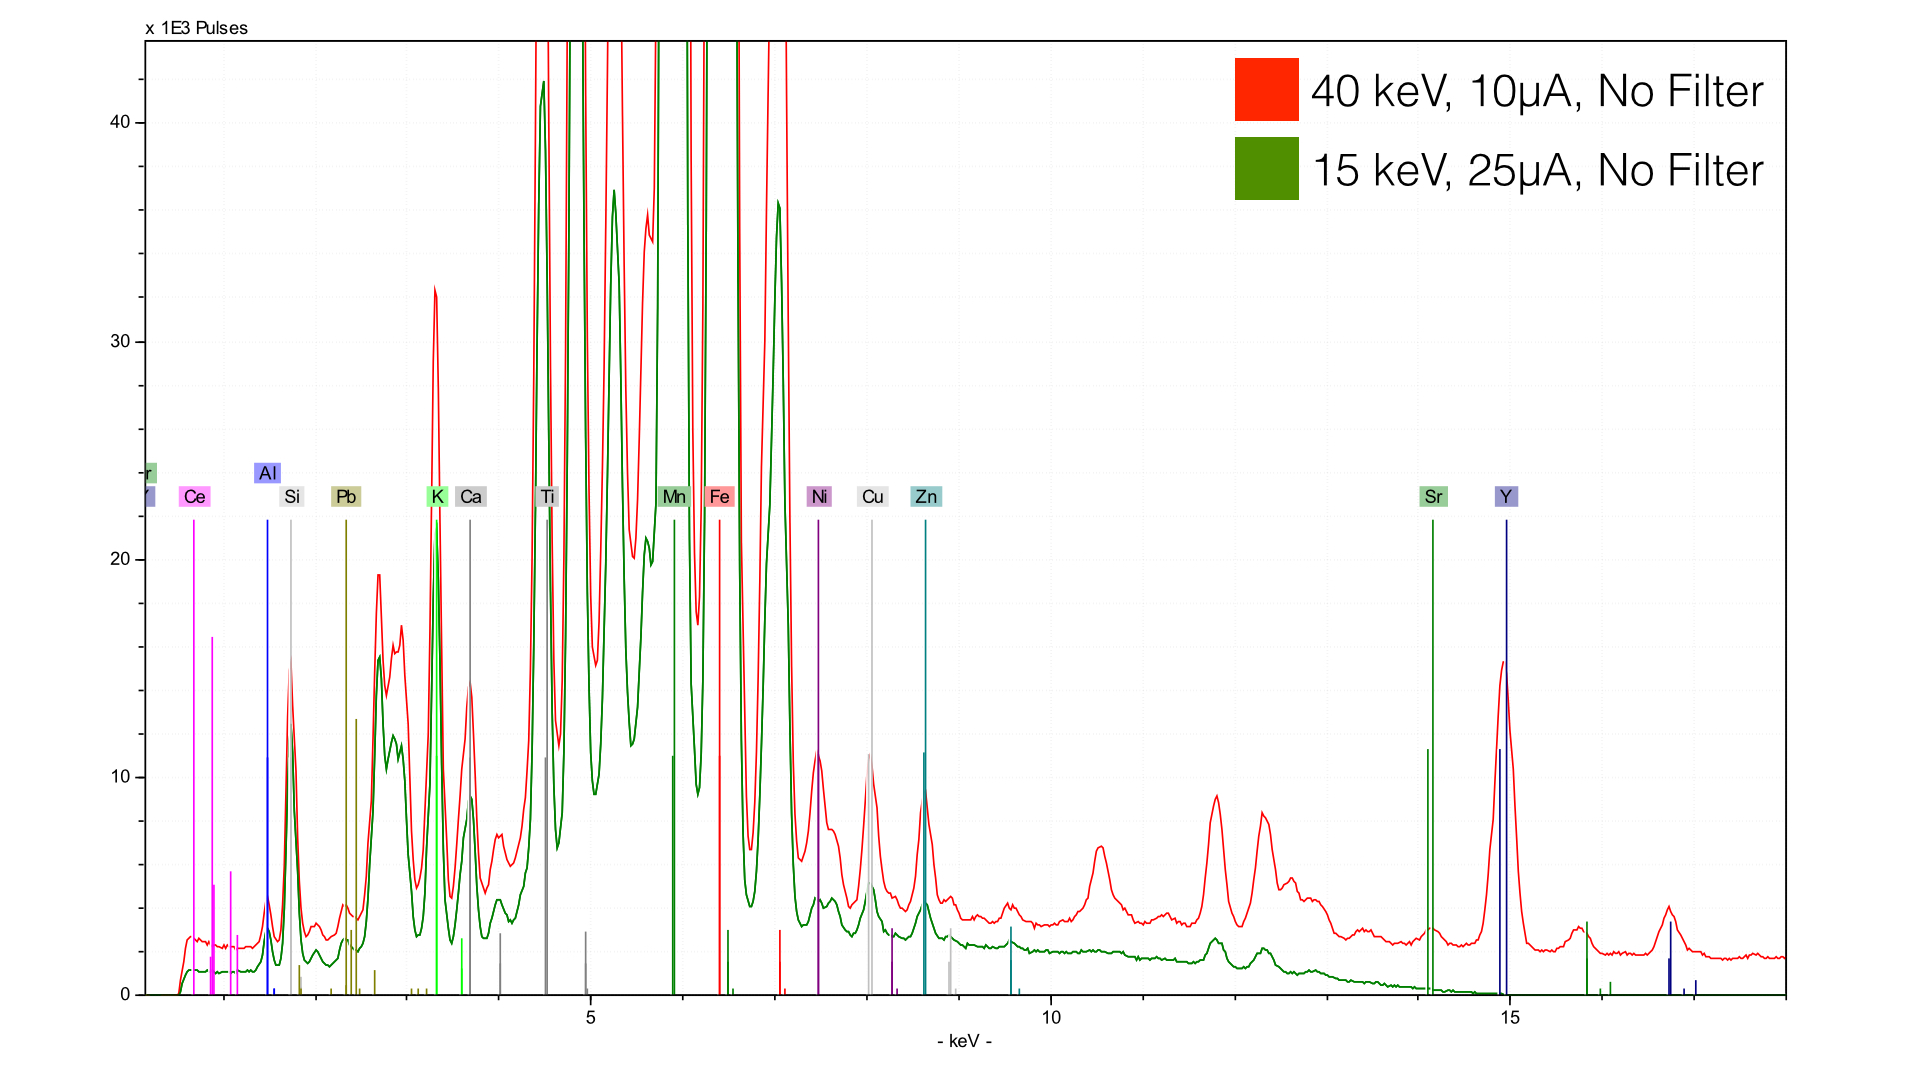
Here, you see a spectra taken at 40 keV (red) and at 15 keV (green). You can see that the green spectrum terminates at 15 keV, while the 40 keV spectra continues off screen. The main result of the energy selection is what element you are able to see. So why would we bother taking a spectra with a lower energy, and thus lower element, range?
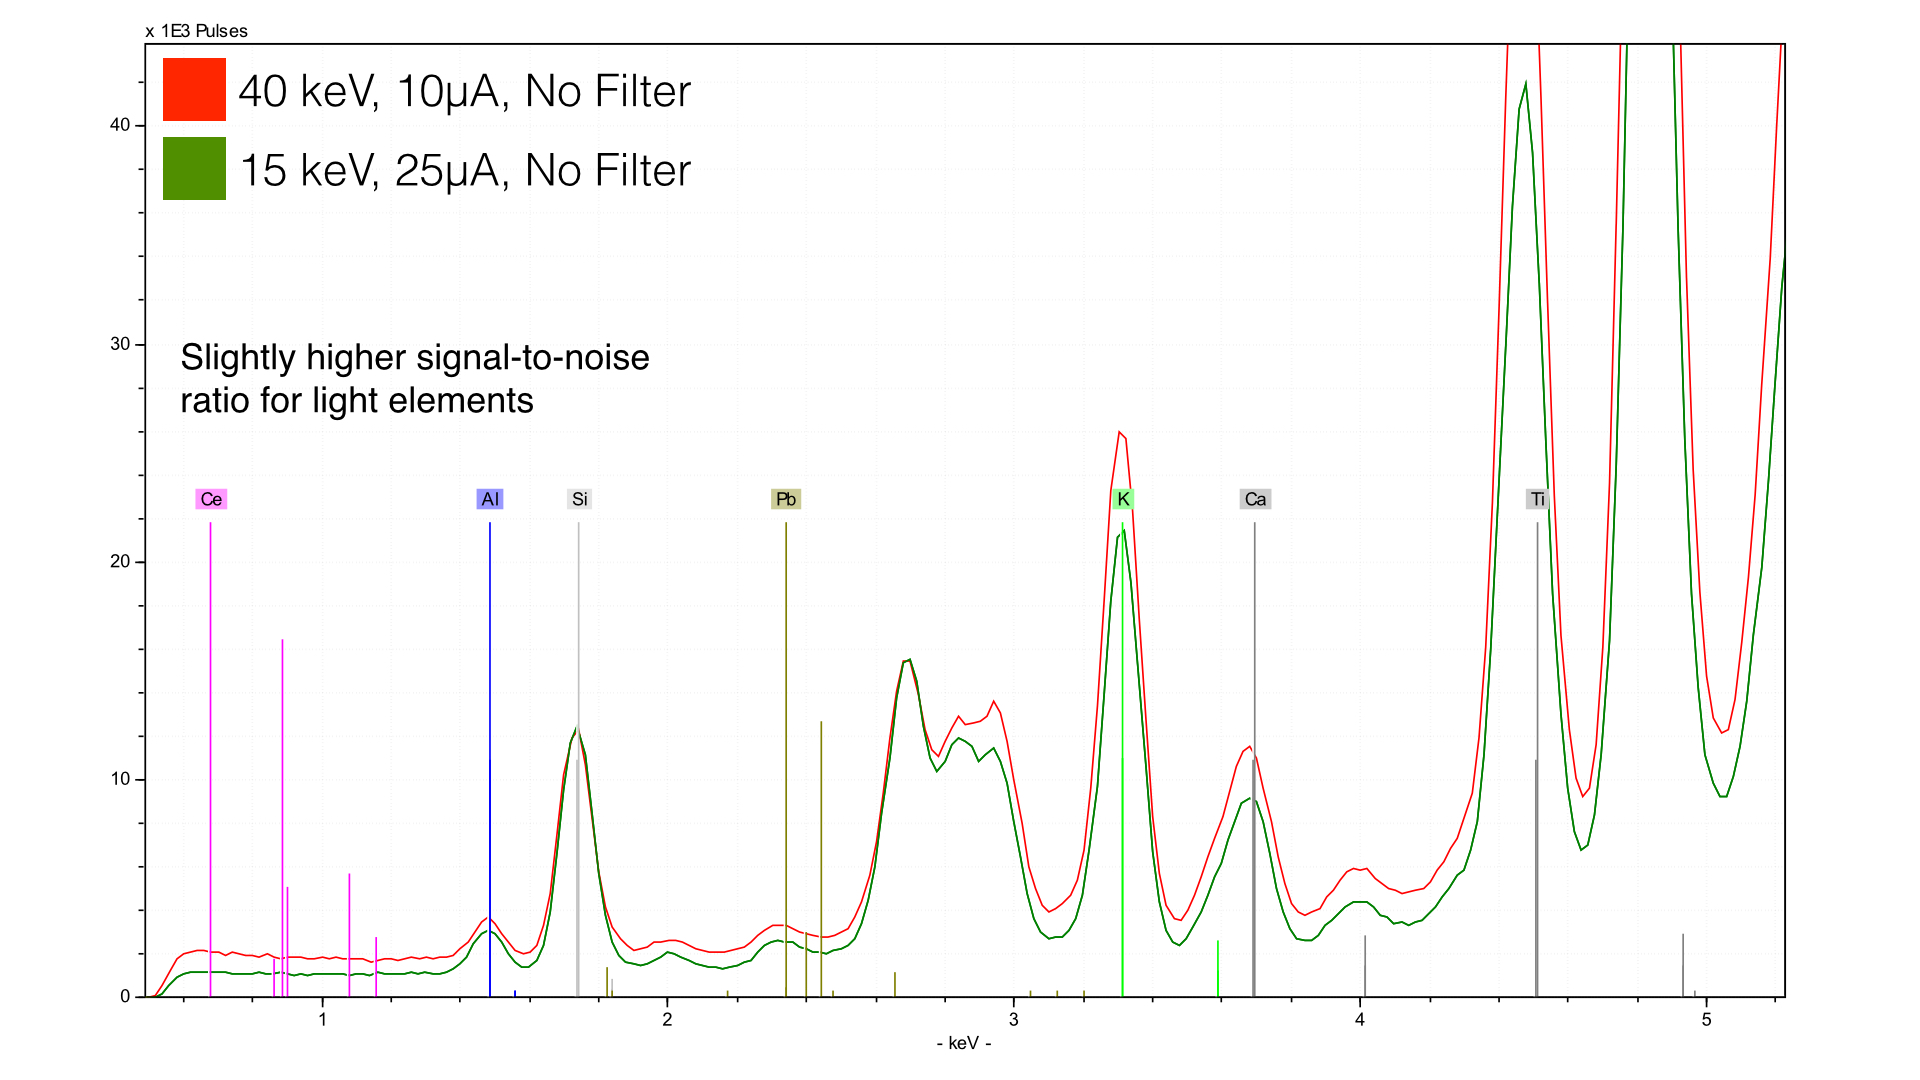
The answer is that we get a better signal-noise ratio for light elements - you can see the lower baseline that the 15 keV (green) spectrum has. This is absolutely critical for light elements - you can further improve their sensitivity by changing the atmosphere using a vacuum or helium gas.
This effect works in the opposite direction too - what happens when we measure at more than 40 keV?
This effect works in the opposite direction too - what happens when we measure at more than 40 keV?
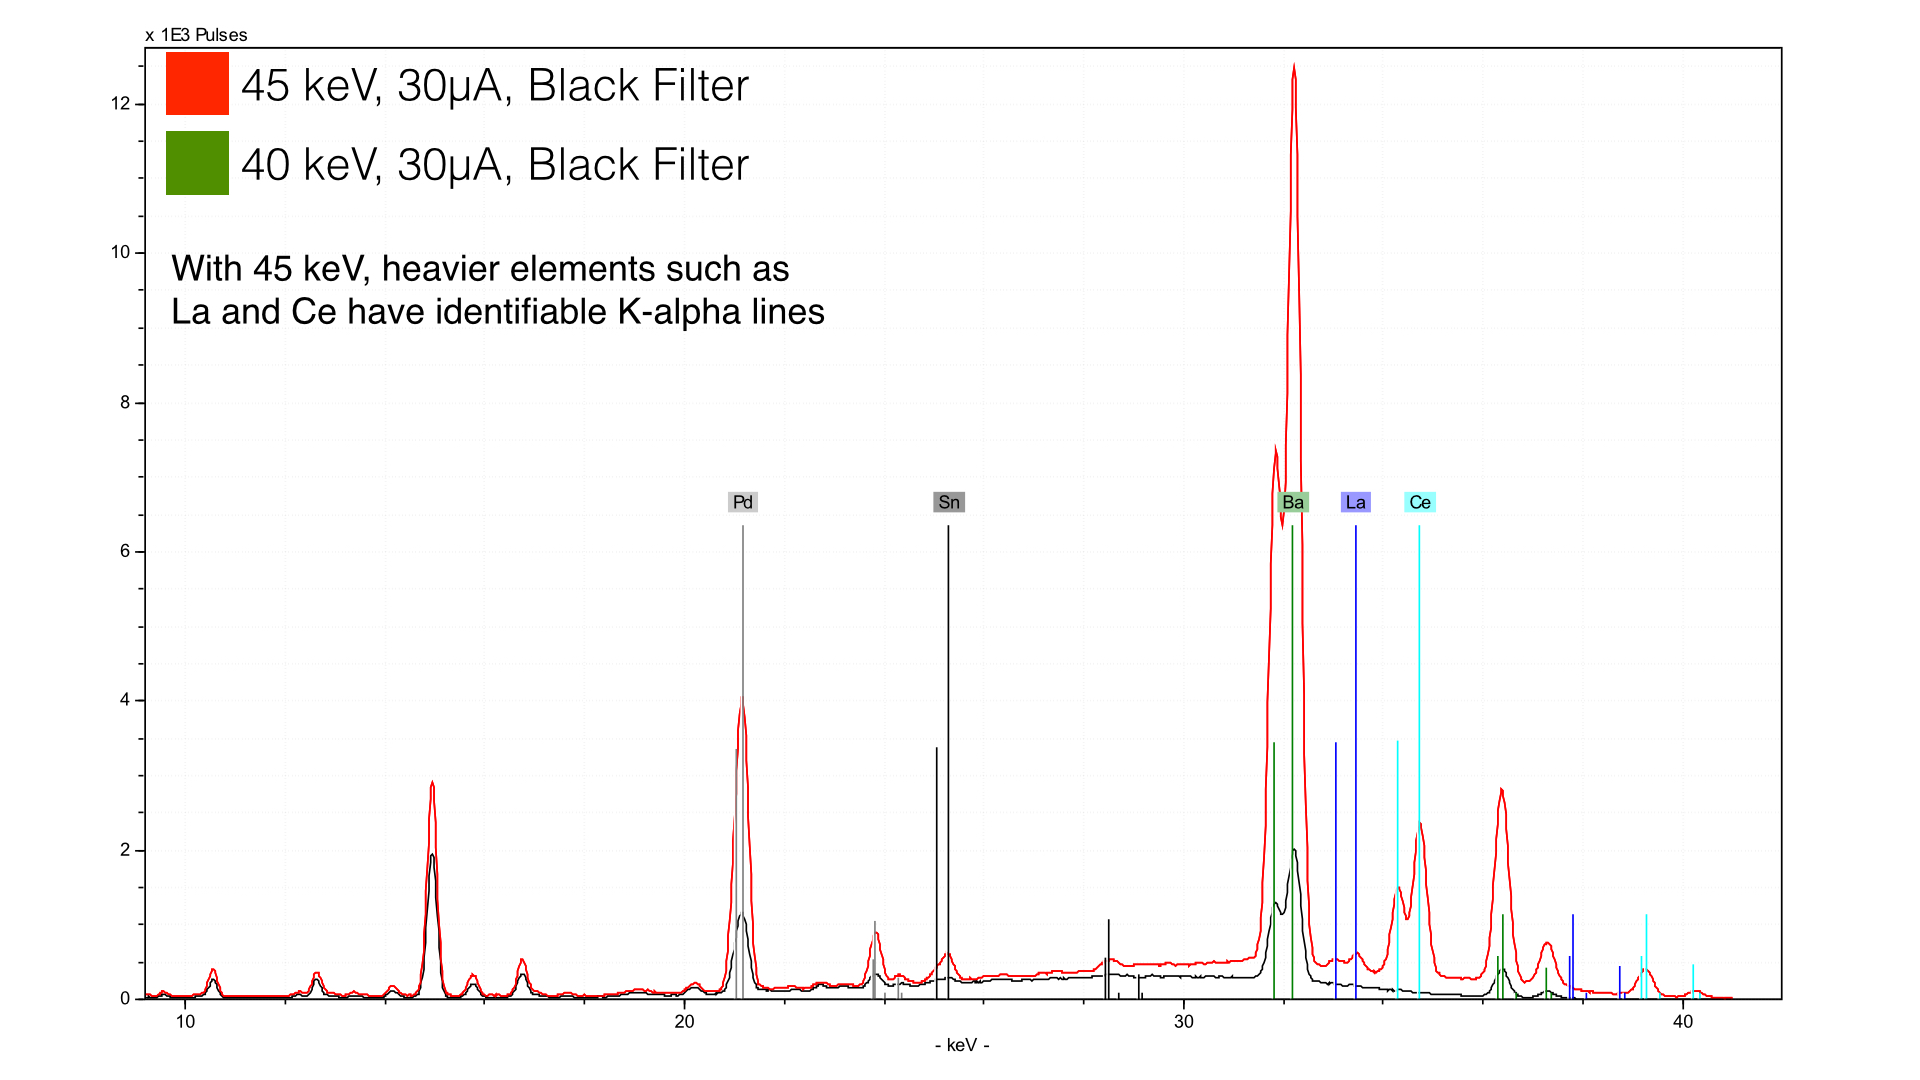
Here, we have taken data with the black filter (250 μm Cu/25 μm Ti/300 μm Al) and we are analyzing at either 45 keV (red) and 40 kev (green). You can see much higher peaks for the heaviest elements (Ba, La, and Ce). If you look closely to the left, you will see that other peaks are higher too. The reason is that with an expanded energy range there are more high energy photons to excite these elements.
Summary
The objective of changing energy and the filter is to maximize sensitivity to elements of interest. Energy in particular is critical to get right - you will blind yourself to elements if you do not send in photons with sufficient energy to excite them. A filter is aimed at optimizing the signal to noise ratio once you have selected an element if interest. Simply put, if you need to use a filter, you already are driven by a question. If you are not sure what you will find, keep the energy at its maximum and don’t use a filter. Once you find an element of interest, you can adjust filter and voltage accordingly.